Figure 7.

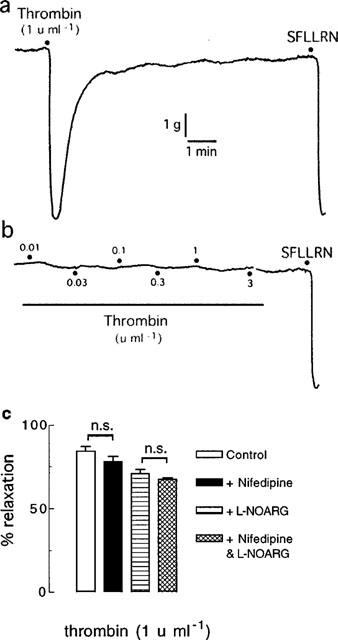
Digitized traces of original chart recordings showing responses to thrombin added (a) as a single, high concentration (1 u ml−1) and (b) cumulatively (0.01–3 u ml−1) to artery rings treated with nifedipine (0.3 μM) and L-NOARG (100 μM) and contracted to ∼50% of their maximum contraction with U46619. These traces are representative of six experiments. (c) Group data from similar experiments (each n=6) as depicted in (a). n.s.=not significant.
