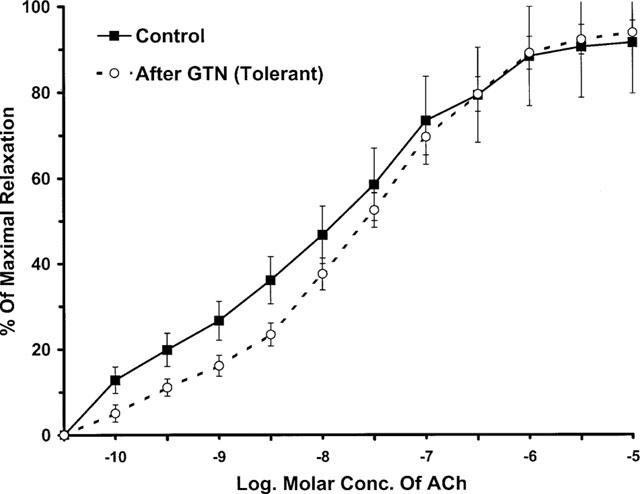
Figure 4.

ACh-induced vasorelaxant responses of GTN-tolerant and non-tolerant aortic segments. The pD2 value for ACh in non-tolerant vessels is similar to the tolerant vessels (7.72±0.31 vs 7.63±0.33, respectively). However, the curves are significantly different at concentrations up to 10−8 M of ACh (P<0.05). Data are represented as the mean of eight experiments±s.e.mean.
