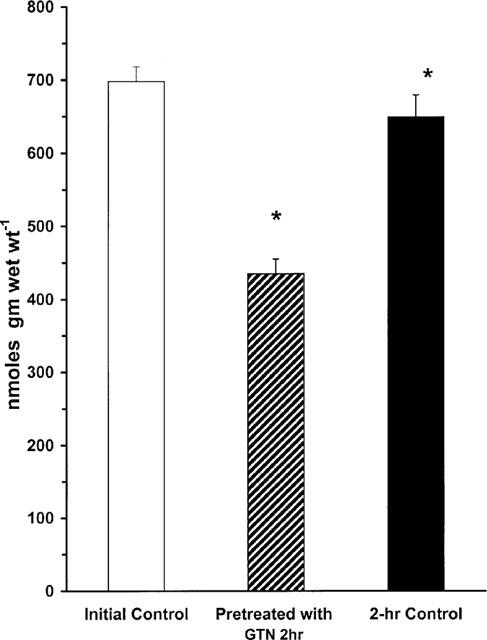
Figure 5.

L-arginine content in rat aortic segments pre-constricted with phenylephrine. The figure shows L-arginine levels in control buffer initial (n=11), presence of GTN for 2 h (5×10⁻⁴ M, n=7), and control buffer for 2 h (n=8). *Indicates a difference from values for both initial control buffer and control buffer after 2 h (P<0.05).
