
Figure 3.
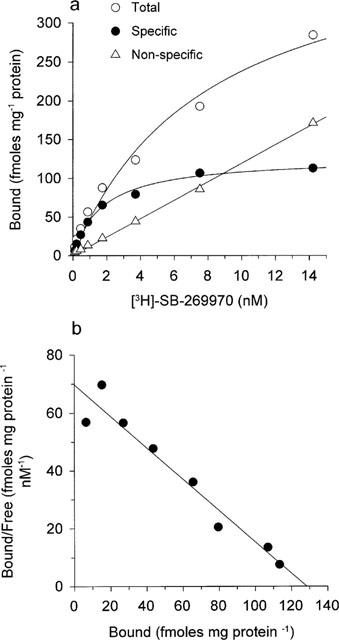
(a) Saturation analysis of [3H]-SB-269970 binding to guinea-pig cerebral cortex membranes. Data points show total binding, non-specific binding (defined in the presence of 10 μM 5-HT) and specific binding, calculated by subtracting non-specific binding from total binding. Data are from a typical experiment performed using triplicate determinations and repeated twice (n=3). (b) Scatchard plot (bound in pmoles mg protein−1 versus bound/free (pmoles mg protein−1 nM−1)) of the specific binding data shown in (a).