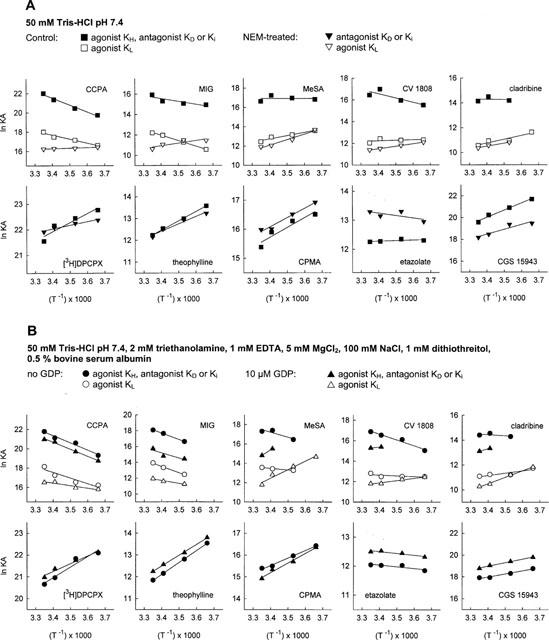
Figure 1.

van't Hoff plots for ligand binding to A1 adenosine receptors in rat brain membranes. (A) Binding experiments were conducted in 50 mM Tris-HCl pH 7.4 (A) with membranes not pretreated or pretreated with NEM. (B) Experiments were performed in 50 mM Tris-HCl pH 7.4, 2 mM triethanolamine, 1 mM EDTA, 5 mM MgCl2, 100 mM NaCl, 1 mM dithiothreitol and 0.5% bovine serum albumin or, alternatively, in the same incubation medium containing in addition 10 μM GDP. KD values for [3H]-DPCPX are from saturation experiments. KH values for agonists, KD and Ki values for antagonists are indicated by filled symbols, KL values for agonists are shown as open symbols. The lines in the figure are the linear regression lines of lnKA from 3–6 experiments for each compound versus (T−1).
