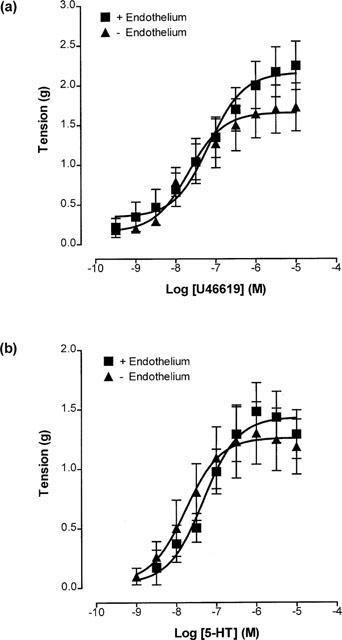
Figure 4.

Concentration-response curves showing contractions to (a) U46619 (0.3 nM–10 μM) and (b) 5-HT (1 nM–10 μM) on endothelium-containing and endothelium-denuded rings of porcine cerebral artery, placed under 1 g of stretch. Each point is the mean±s.e.mean of 6–8 observations.
