
Figure 2.
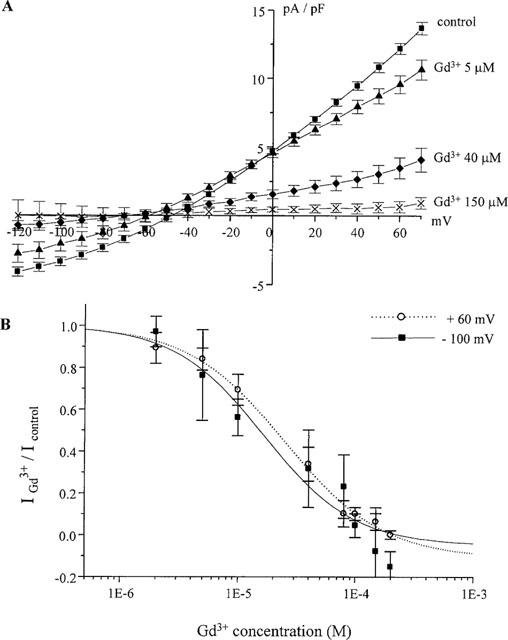
Dose- and voltage-dependence of Gd3+ inhibition of INaCa. (A) Mean I-V relationship of current amplitudes at different Gd3+ concentrations. Gd3+ subsequently suppressed INaCa. (B) Dose-response curves for the effect of Gd3+ on INaCa. Currents were measured at +60 mV and −100 mV. Continuous curves were plotted according to the Michaelis-Menten equation: IGd3+/Icontrol =1/(1+([Gd3+]/IC50)h). h is Hill coefficient.