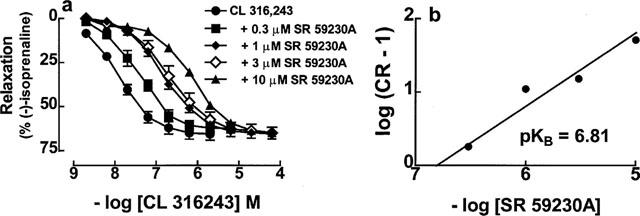
Figure 2.

Relaxant responses in 129 Sv mouse colon to CL 316,243 and blockade by SR 59230A. Responses are to CL 316,243 in the absence or presence of SR 59230A. All experiments were carried out in the presence of 200 nM (−)-propranolol. Values shown are mean±s.e.mean (vertical lines, where larger than symbol size for experiments with n⩾4), n=2–8 tissues for each curve. The corresponding Schild-plot is shown in (b). The slope of the Schild-plot was not significantly different from 1.0 (slope 0.90±0.16) and was therefore constrained to unity.
