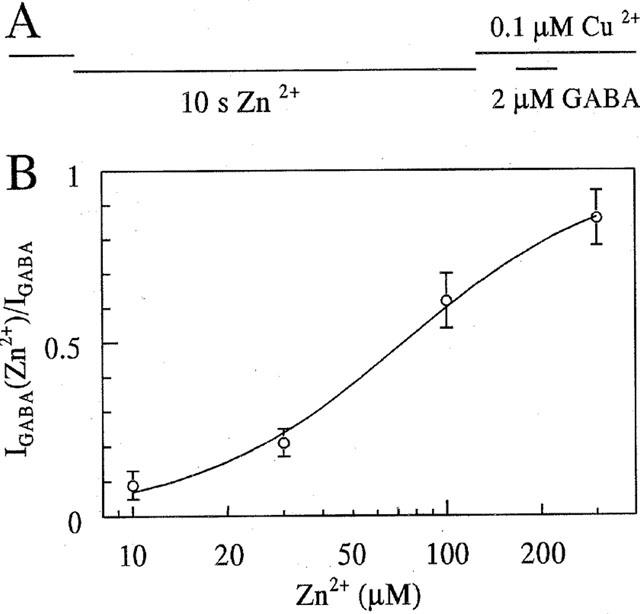
Figure 4.

Zn2+ reduces Cu2+-block in a concentration dependent manner. (A) Real-time-scheme of experiments; upper line: Cu2+, lower lines Zn 10−300 nM for 10 s and GABA 2 μM for 1 s. data points in the dose response curve are normalized to control GABA responses and represent the mean responses of five cells. The data are fitted by equation 2 with EC50=72±13 μM, n=1.35±0.3.
