
Figure 4.
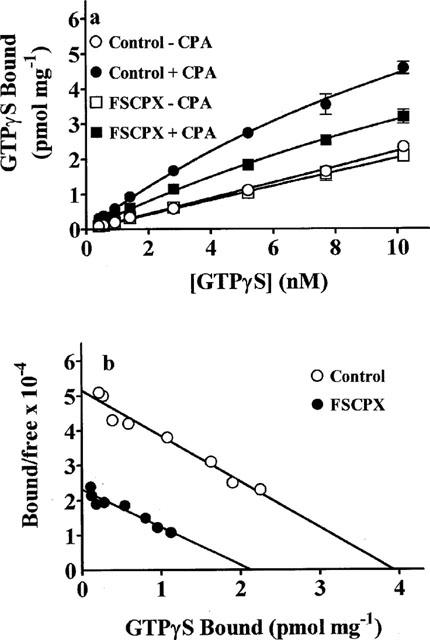
Representative [35S]-GTPγS binding (a) and Scatchard plot (b) of the CPA-stimulated [35S]-GTPγS binding component after pretreatment with FSCPX. DDT cells were incubated in the absence (control) or presence of 5 nM FSCPX for 20 min at 37°C followed by 15 cell washes. Cell membranes were then prepared and the concentration-dependence of [35S]-GTPγS binding, using cold GTPγS with 0.4 nM [35S]-GTPγS, in the absence (basal) and presence of CPA (5 μM) was determined. Points on the graph are means±s.d. of triplicate determinations and are representative of three separate experiments. In (b), the net CPA-stimulated [35S]-GTPγS binding is shown as a Scatchard plot.