
Figure 1.
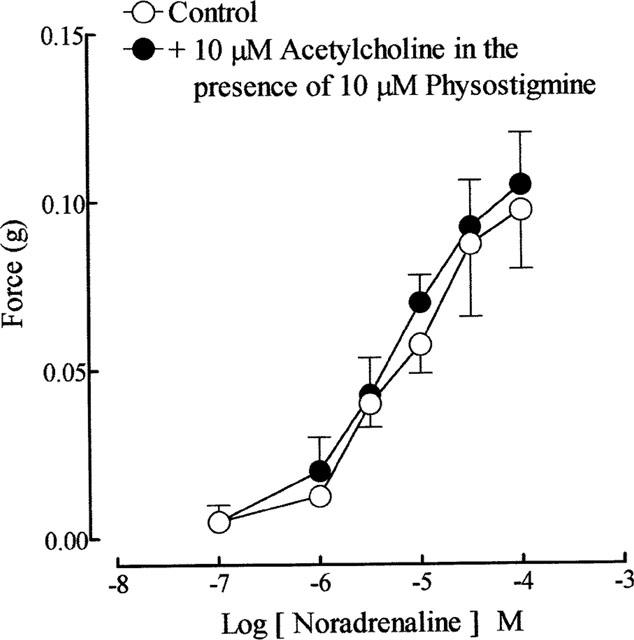
Mean log sequential concentration-response curves to noradrenaline on the guinea-pig prostatic preparations before and after exposure to acetylcholine (10 μM) in the presence of physostigmine (10 μM). Data are shown as mean values with vertical lines representing s.e.mean from four experiments.