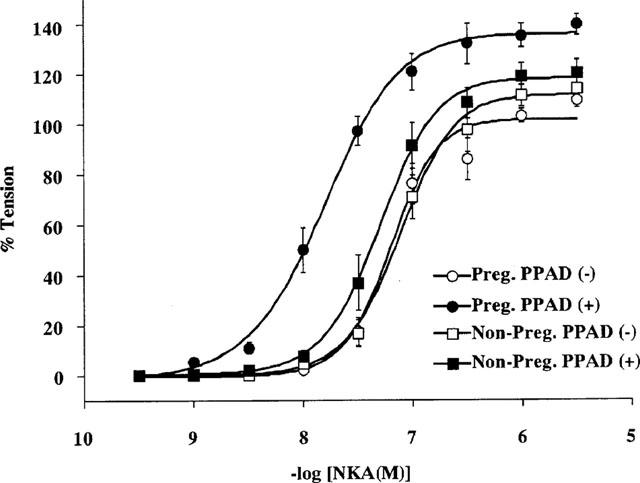
Figure 2.

Concentration-response relationships of NKA-induced rat myometrial contraction. Various concentrations of NKA (0.3 nM–10 μM) were applied to the day 18 pregnant and non-pregnant rat myometrium in the presence or absence of PPAD and the peak level of each tension development was plotted. Each tension experiment was performed under conditions similar to those shown in Figure 1. Each symbol shows the mean value of the NKA-induced developed tension from six different rats. Vertical bars represent the s.e.mean.
