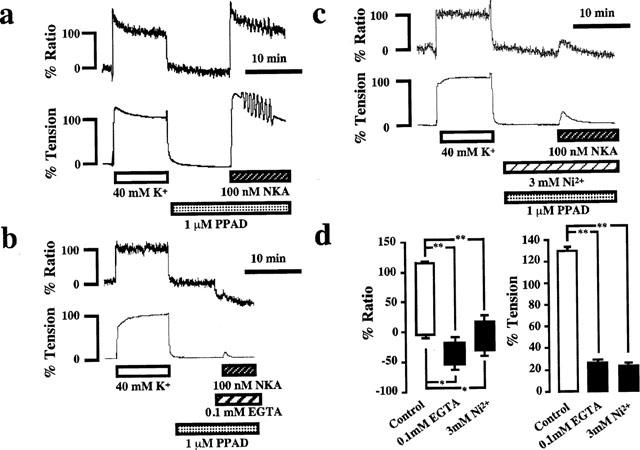
Figure 3.

NKA-induced intracellular Ca2+ release. (a–c) Representative recordings showing the effect of NKA (100 nM) on the [Ca2+]i (upper trace) and tension (lower trace) of the pregnant rat myometrium in normal PSS (a), in Ca2+-free PSS containing 0.1 mM EGTA (b) and in normal PSS containing 3 mM Ni2+ (c). PPAD and Ni2+ was added 10 min before and during NKA application. (b) Ca2+-free PSS with 0.1 mM EGTA was applied 1 min before and during the addition of NKA. (d) Summary of the inhibitory effect of Ca2+-free PSS with 0.1 mM EGTA and Ni2+ on the NKA-induced increases in [Ca2+]i and tension. The bottom and top of each column indicate the levels of [Ca2+]i and tension just before the NKA application and at the peak elevation induced by NKA, respectively, under the indicated conditions. All data are expressed as the mean±s.e.mean. (The vertical bars) obtained from experiments similar to those shown in a–c using 4–6 different animals. *P<0.05, **P<0.01.
