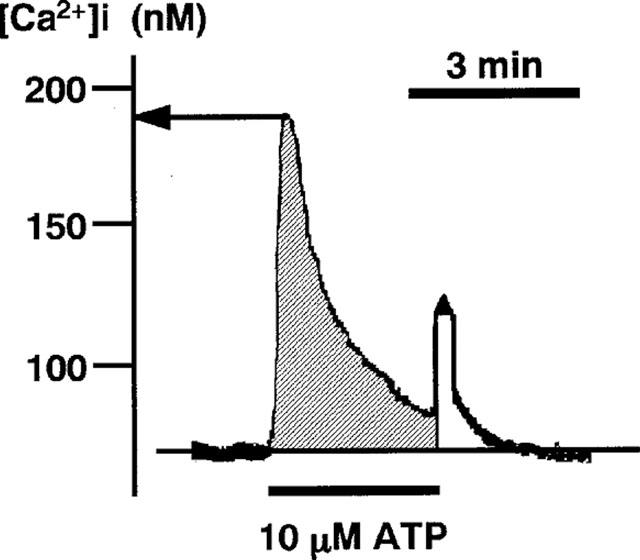
Figure 1.

A recording of [Ca2+]i converted from the fura-2-fluorescence ratio (F340/F380). The trace of fluorescence ratio was converted onto the linear scale of the absolute value of [Ca2+]i as described in Methods. The [Ca2+]i (ordinate) is shown in nM. The peak [Ca2+]i is determined as indicated by an arrow. The shaded area indicates the area under the [Ca2+]i curve (integrated [Ca2+]i elevation).
