
Figure 6.
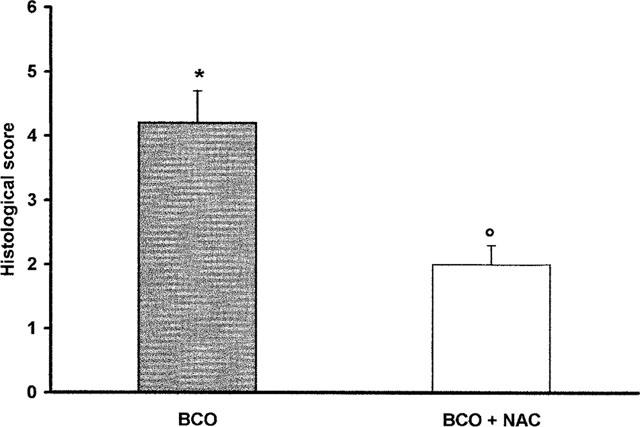
Effects of NAC on histological score obtained by the microscopic observation of CA1, area of post-ischaemic animals. Values are means±s.e.means of eight animals for each group. *P<0.01 versus sham. °P<0.01 versus BCO.
Official websites use .gov
A
.gov website belongs to an official
government organization in the United States.
Secure .gov websites use HTTPS
A lock (
) or https:// means you've safely
connected to the .gov website. Share sensitive
information only on official, secure websites.
Effects of NAC on histological score obtained by the microscopic observation of CA1, area of post-ischaemic animals. Values are means±s.e.means of eight animals for each group. *P<0.01 versus sham. °P<0.01 versus BCO.