
Figure 5.
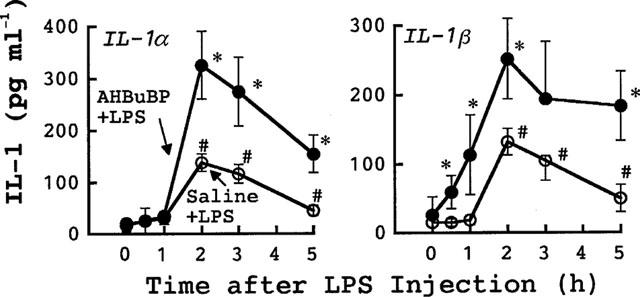
Effects of AHBuBP on the E. coli LPS-induced elevation in the serum levels of IL-1α and IL-1β in control BALB/cA mice. The blood of each mouse used for Figure 4 was assayed for IL-1α and IL-1β. Each value is the mean±s.d. from four mice. *P<0.05 vs saline+LPS group. #P<0.05 vs time 0.