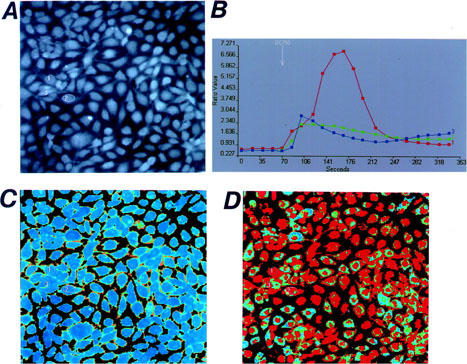
Figure 4.

Two-dimensional image of the [Ca2+]i responses in cultured bovine aortic endothelial cells (×200). Microscope images of the fura-2-loaded cultured cells are shown in (A). The resting F340/F380 ratio image is shown in (B), and the image in the presence of deoxycholic acid (DC, 750 μM) is shown in (D). The time courses of the changes in the F340/F380 ratio obtained from three different cells before and after the application of DC are shown in (B). The location of each cell is indicated in (A). Results are representative of four similar experiments.
