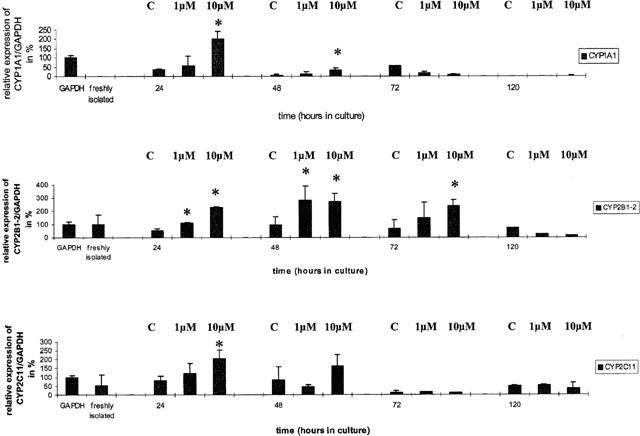
Figure 2.

mRNA expression of cytochrome P450 1A1, 2B1/2 and 2C11 relative to GAPDH in cardiomyocyte cultures. The GAPDH signal was set to 100%. Data represent mean±standard deviation for n=3 individual cell culture experiments with approximately 2 million cells per culture dish (**, P=<0.05 compared with controls). (C=control, 1 μM and 10 μM=concentration of Aroclor 1254).
