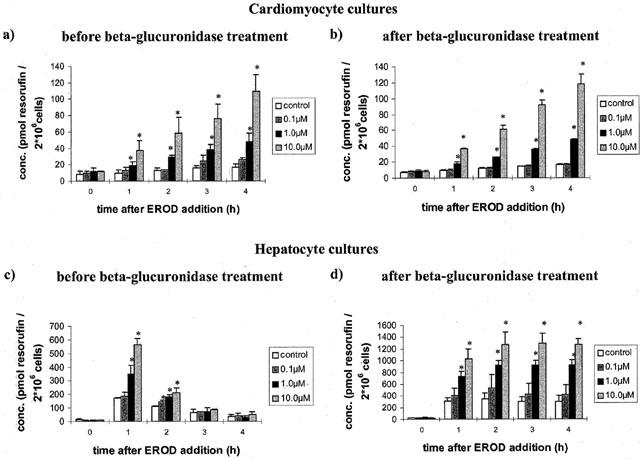
Figure 5.

Metabolism of 7-ethoxyresorufin in control and Aroclor 1254 (10 μM) treated cardiomyocytes before (a) and after (b) treatment with 100 u ml−1 β-glucuronidase 24 h post isolation and cultivation. Metabolism of 7-ethoxyresorufin in control and Aroclor 1254 (10 μM) treated hepatocytes before (c) and after (d) treatment with 100 u ml−1 β-glucuronidase 24 h post isolation and cultivation. Data represent mean±standard deviation for n=3 individual cell culture experiments with approximately 2 million cells per culture dish. *, P=<0.05 compared with controls.
