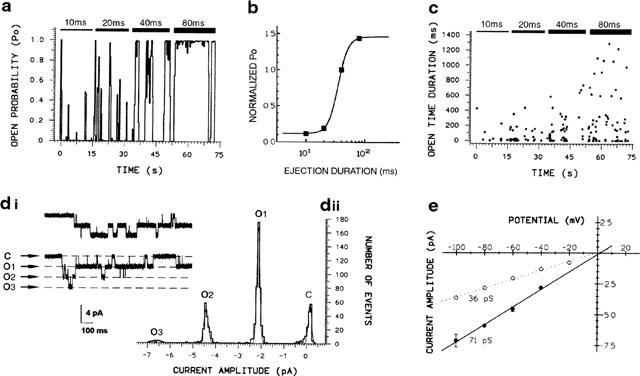
Figure 2.

Study of the dependence of channel activity on GABA concentration. Continuous single channel recordings were divided into consecutive 20-s segments while GABA (50 μM) was applied through the pipette at various pressure-pulse durations. (a) Plot of Po versus time for unitary currents activated by GABA at −60 mV. During data acquisition, the duration of the pressure ejection pulse from the pipette was increased as indicated above the graph. (b) Representative dose-response curve constructed from data shown in (a). Each point is the Po value measured on the same patch for each individual segment and corresponds to data which were normalized to the Po value obtained in response to a 40-ms pulse of GABA. (c) Corresponding open time duration plotted versus time of application, showing that the duration of channel opening depends on the dose of ejected GABA. (di) Example of single channel currents observed at −60 mV under repeated application of GABA (pulse of 150 ms; intervals: 900 ms). The dotted lines represent the amplitude of the different conductance levels obtained from Gaussian fits of the amplitude distribution displayed to the right of the current traces. (dii; c: closed-state; o1 to o3: open-states). Means of the Gaussian components are given in the text. (e) Single channel I/V plot for the second conductance level is superimposed on the main conductance state (indicated by the dashed line). The slope conductance is 71 pS. Each data point represents the mean±s.e.m. (n=5).
