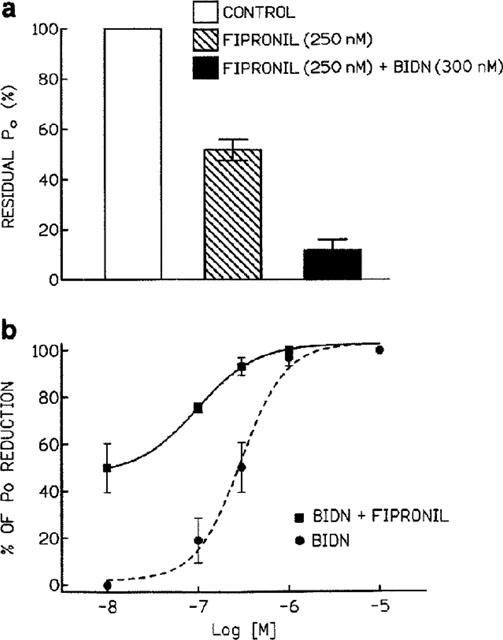
Figure 6.

Effect of co-application of fipronil and BIDN on the RDL receptor. (a) Comparative histogram of the percentage of residual Po measured after application of 250 nM fipronil and a solution containing 250 nM fipronil+300 nM BIDN. These concentrations are close to the IC50 values calculated from the semi-logarithmic dose-response curve. (b) Dose-response curve for the inhibitory actions of simultaneously applied fipronil and BIDN on Po. The smooth line represents the best fit to the mean data points according to the Hill equation (n=3). The dotted line represents the dose-response curve for BIDN alone.
