
Figure 1.
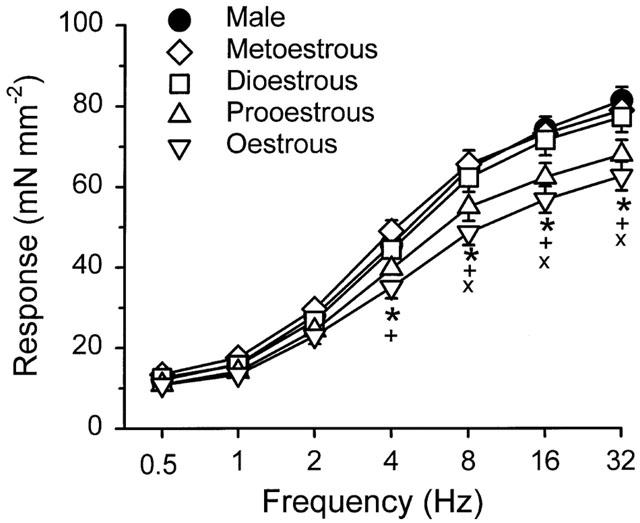
Frequency-response relationship of bladder body strips from male rats and female rats during different stages of the oestrous cycle. Each point represents the mean±s.e.mean (n=9–23). Significantly different from *males, +metoestrous, or ×dioestrous at P<0.05.