
Figure 2.
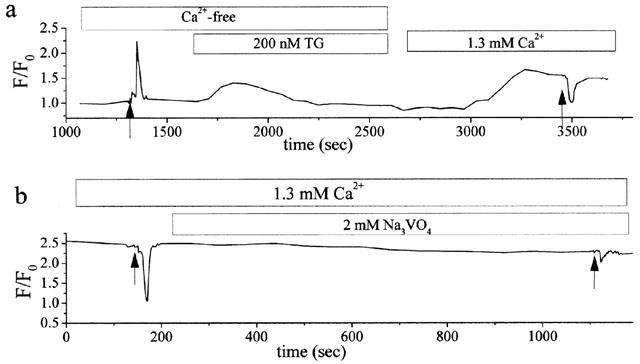
(a) Comparison of the amount of [Ca2+]i changes between ATPo (arrows: 50 μM, 20 s)-induced [Ca2+]i increase and decrease (see text for details). (b) Inhibition of ATPo-induced decrease in [Ca2+]i by 2 mM orthovanadate. Cells were incubated in culture medium containing 200 nM TG during 30-min Fluo-3 loading before rinsing with the Ca2+-free solution. [Ca2+]i was elevated with the standard solution containing 1.3 mM Ca2+ like that in (a). ATPo (arrows: 50 μM, 20 s) was applied to the cells once the [Ca2+]i had reached a steady-state level.