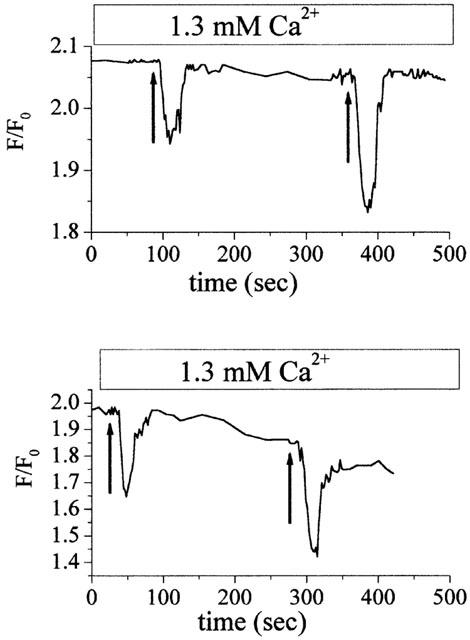
Figure 4.

Reduction of steady-state [Ca2+]i by UTP and ATPγS in the cells pretreated with TG. (a) Comparison of steady-state [Ca2+]i decreases by UTP and ATPo. First arrow: 50 μM UTP, 20 s; second arrow: 50 μM ATP, 20 s. (b) Comparison of steady-state [Ca2+]i decreases by ATPγS and ATP. First arrow: 50 μM ATPγS, 20 s. Second arrow: 50 μM ATP, 20 s. Experimental procedures in both (a) and (b) as in Figure 2b.
