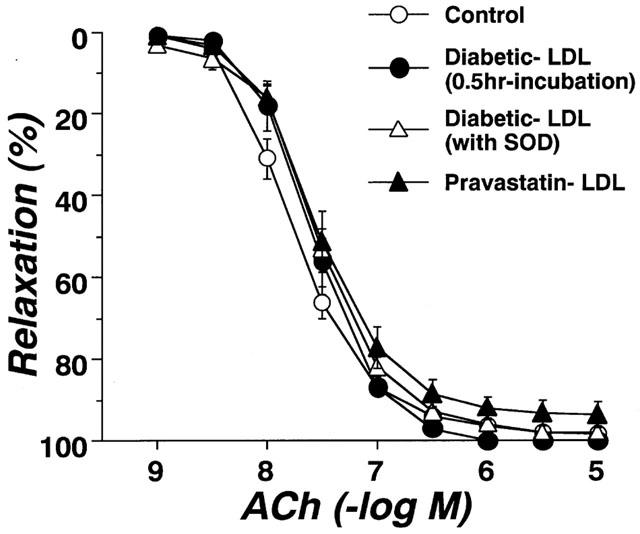
Figure 5.

Effects of incubation for 0.5 h with diabetic-LDL, or for 6 h with either diabetic-LDL plus SOD or pravastatin-LDL on concentration-response curves for acetylcholine-induced relaxation in aortic strips from control rats. The LDL were taken from untreated diabetic or pravastatin-treated diabetic rats. Each data point represents mean±s.e.mean of six experiments; the s.e. is included only when it exceeds the dimension of the symbol used.
