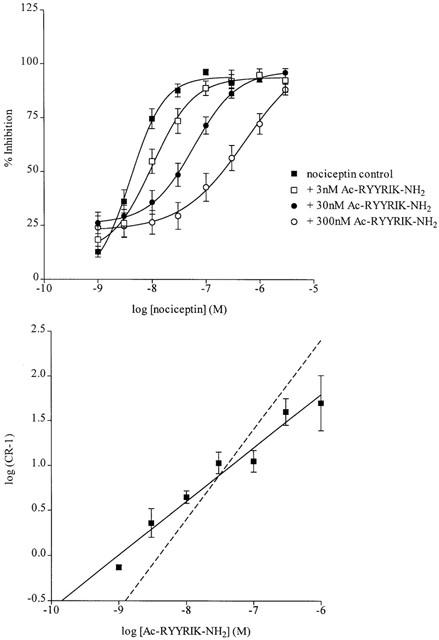
Figure 2.

Antagonism by the partial agonist Ac-RYYRIK-NH2 (1 nM–1 μM) of the effect of nociceptin in the rat anococcygeus. Top: concentration-response curves to nociceptin in untreated preparations, or after incubation with Ac-RYYRIK-NH2 at 3, 30, or 300 nM. Each point is the mean±s.e.mean of at least four observations. Data for the experiments with 1, 10 and 100 nM and 1 μM Ac-RYYRIK-NH2 have been omitted for the sake of clarity. Bottom: Schild regression for the interaction between Ac-RYYRIK-NH2 and nociceptin, showing the line of best fit (log{CR−1}=0.6{log[Ac-RYYRIK-NH2]}+9.01), and the theoretical line of unit slope (dashed line).
