
Figure 2.
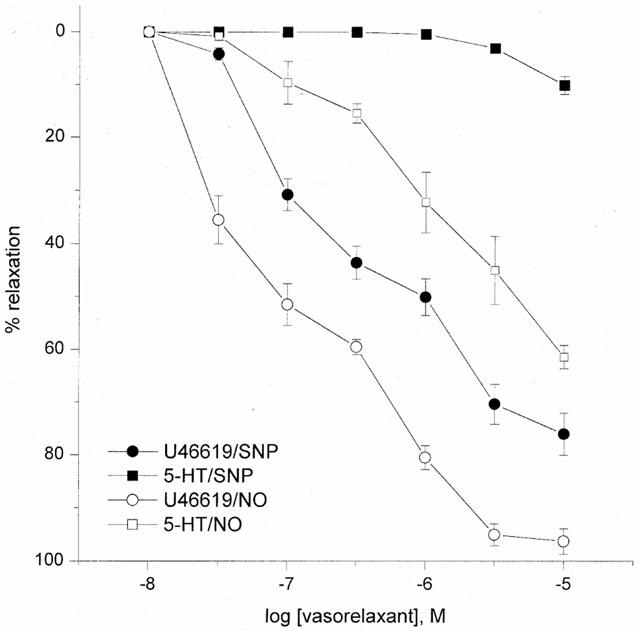
Concentration-response curves for NO- and SNP-induced relaxations in 5-HT and U46619 pre-contracted tissue. Each point represents the arithmetic mean±s.e.mean of n=5 and 6 experimental determinations.
Official websites use .gov
A
.gov website belongs to an official
government organization in the United States.
Secure .gov websites use HTTPS
A lock (
) or https:// means you've safely
connected to the .gov website. Share sensitive
information only on official, secure websites.
Concentration-response curves for NO- and SNP-induced relaxations in 5-HT and U46619 pre-contracted tissue. Each point represents the arithmetic mean±s.e.mean of n=5 and 6 experimental determinations.