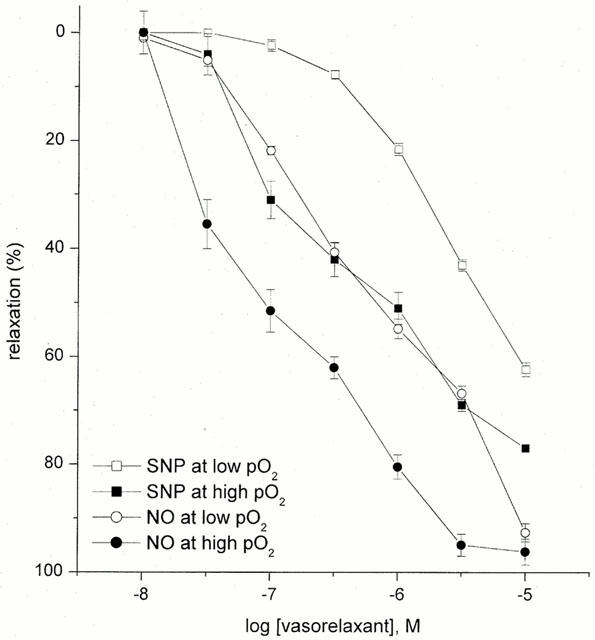
Figure 3.

Concentration-response curves for NO- and SNP-induced relaxation in U46619 pre-contracted tissue at low (<55 mmHg) versus high (>300 mmHg) oxygen tension. Each point represents the arithmetic mean±s.e.mean of n=5 experimental determinations.
