
Figure 2.
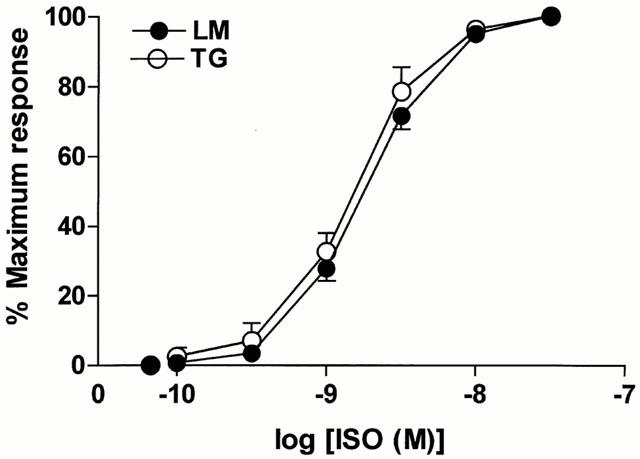
Comparison of the normalized concentration-response curves to (−)-isoprenaline (ISO) in myocytes from TGβ2 (open circles, n=6) and LM (solid circles, n=19) mice. The range of concentrations of ISO was from 3×10⁻¹¹ to 3×10⁻⁸. The concentration–response curves were not significantly different between TGβ2 and LM mice.