
Figure 1.
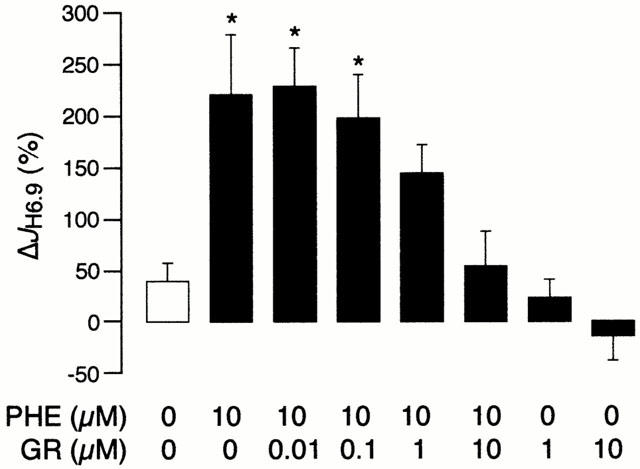
The change in H+ efflux rate at pHi 6.90 (ΔJH6.9) in the control group and in response to phenylephrine (PHE) and GR79236 (GR), alone or in combination. The protocol comprised 80 myocytes (n=10 per group) obtained from 15 hearts. *P<0.05 vs control.