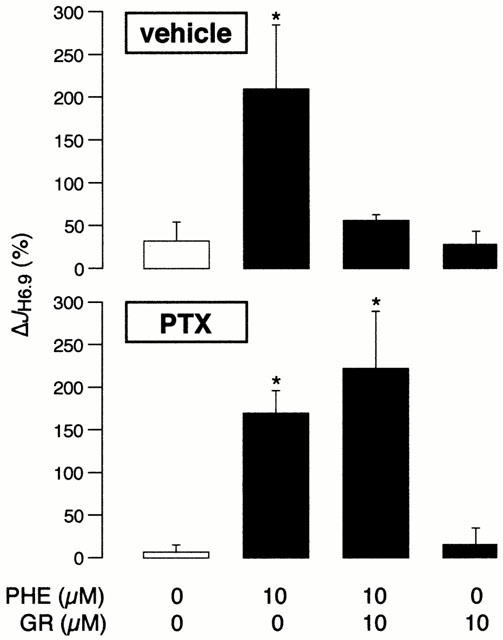
Figure 3.

The change in H+ efflux rate at pHi 6.90 (ΔJH6.9) in the control group and in response to phenylephrine (PHE) and GR79236 (GR), alone or in combination. The protocol comprised 64 myocytes (n=8 per group) obtained from 14 hearts. The cells were pre-treated for 60 min with either vehicle (top panel) or 5 μg ml−1 pertussis toxin (PTX; bottom panel). *P<0.05 vs control.
