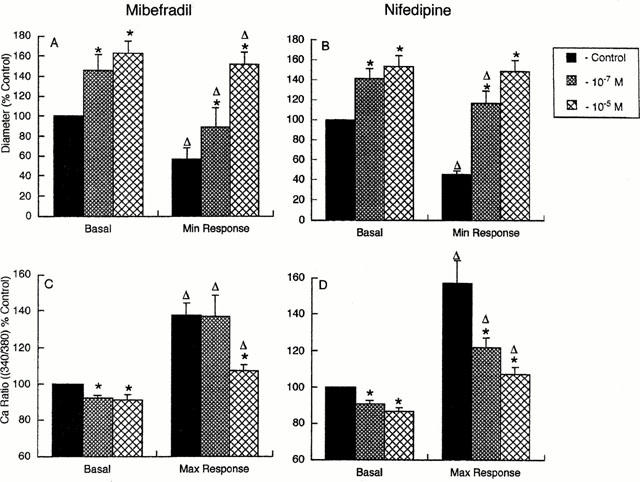
Figure 4.

Group data from experiments summarizing the effects of mibefradil (n=5) and nifedipine (n=5) on diameter (A and B) and Ca2+i (C and D) responses to 60 mM KPSS. Diameters are expressed as per cent of the basal diameter (70 mmHg) in the absence of Ca2+ channel antagonists. Changes in intracellular Ca2+ are presented as a per cent of the basal ratio value. Results are presented as mean±s.e.mean; *P<0.05 compared to corresponding value in the absence of antagonist; ΔP<0.05 compared to basal value at a given antagonist concentration.
