
Figure 3.
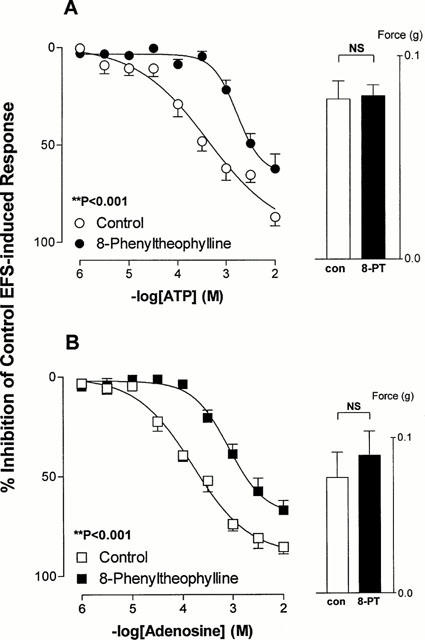
Mean log concentration-response curves for the inhibitory effects of ATP (A) and adenosine (B) on field stimulation induced contractions in rat prostatic preparations in the absence or presence of 8-phenyltheophylline (10 μM). Results are expressed as the percentage inhibition of basal control electrical field stimulation-induced responses. Each point represents the mean±s.e.mean of six experiments. P values are for the concentration×treatment interaction of a 2-way repeated measures ANOVA. The histogram columns represent the mean force developed by control tissues and in the presence of 8-phenyltheophylline prior to the addition of agonists. Vertical bars represent s.e.mean.