
Figure 8.
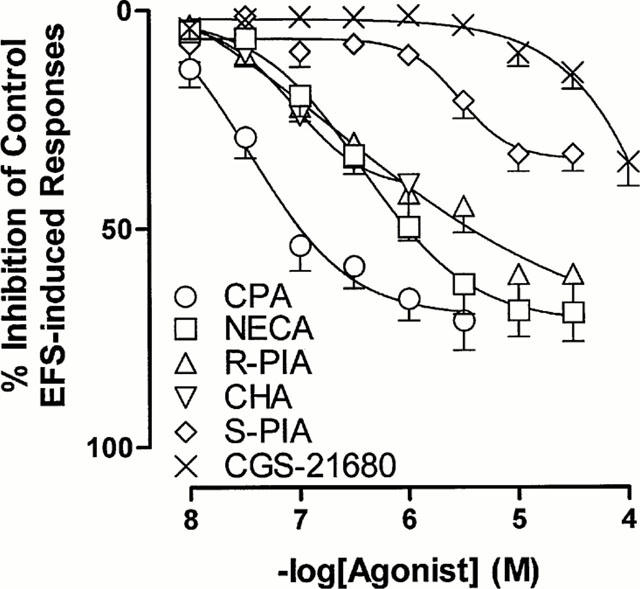
Mean log concentration-response curves for the inhibitory effects of CPA, CHA, R-PIA, NECA, S-PIA and CGS 21680 on the field stimulation induced contractions in control rat prostatic preparations. Results are expressed as the percentage of basal control electrical field stimulation-induced responses. Each point represents the mean±s.e.mean of 5–6 experiments.