
Figure 2.
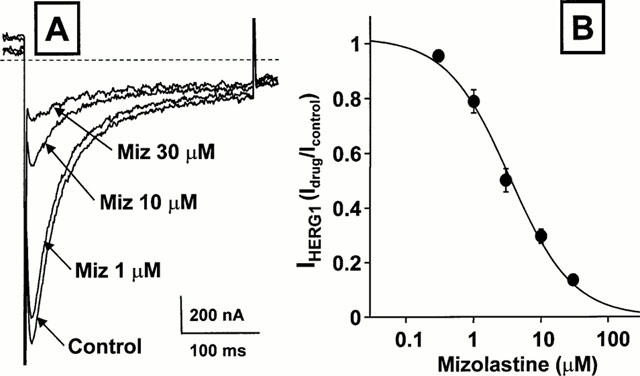
Dose-dependence of the inhibitory action of mizolastine on HERG1 K+ currents expressed in Xenopus oocytes. (A) Representative current traces recorded with the two-microelectrode voltage-clamp technique from a single HERG1-expressing oocyte exposed to control condition, and after perfusion with 1, 10 and 30 μM mizolastine (5 min for each concentration). Holding potential: −90 mV; test potential: 0 mV; return potential: −100 mV. Only the tail currents recorded upon return to −100 mV are shown. The dashed line in the panel indicate the zero current level. (B) Dose-dependence of HERG1 K+ currents inhibition by mizolastine. The inhibitory effect of the different concentration of the H1 receptor antagonist on the peak of the inward HERG1 K+ currents recorded at −100 mV was calculated for several cells and plotted against drug concentrations. The solid line represents the fit of the experimental data to the following binding isotherm: y=max/(1+X/IC50)n, where X is the drug concentration and n the Hill coefficient. The fitted value for n was between 0.72 and 0.96. Each point is the mean±s.e.mean of 3–6 determinations.