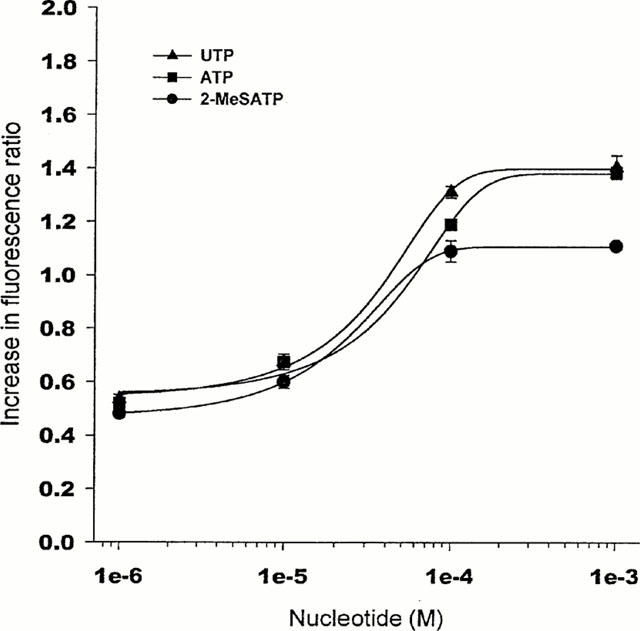
Figure 2.

[Ca2+]i response (fluorescence ratio) as a function of agonist concentration. Endothelial cells were simulated with ATP, UTP or 2-MeSATP for 8 s, and the fluorescence ratio measured at the peak of the [Ca2+]i signal. Curves were fitted with the Hill equation, with no parameters fixed. Results are mean±s.e.mean obtained in three different experiments, n>50 number of cells. s.e.mean is not shown where it is smaller than the symbol.
