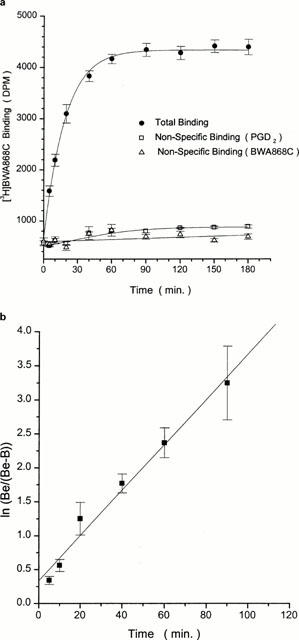
Figure 3.

Time-course of [3H]-BWA868C binding to human platelet homogenates. The data shown in (a) represents total binding and non-specific binding as defined with 10 μM PGD2 or 10 μM BWA868C. (b) shows the linear transformation of the specific binding obtained from the initial binding points from (a). Plots shown are representative of ⩾ three experiments. Vertical lines show s.e.mean within the same experiment.
