
Figure 3.
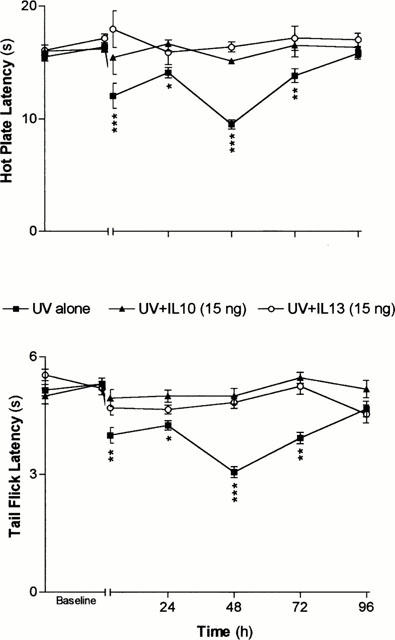
Time courses of the effects of pretreatments with IL-10 (▴) and IL-13 (○) on the hyperalgesia induced by UVB exposure (300 mJ cm2, ▪). Each point in each curve represents the average±s.e.mean of measurement performed on a different group of mice (n=5) for each indicated type of treatment. *P<0.05; **P<0.01 and ***P<0.001 as calculated in reference to the average latency measured before the treatment on each group.