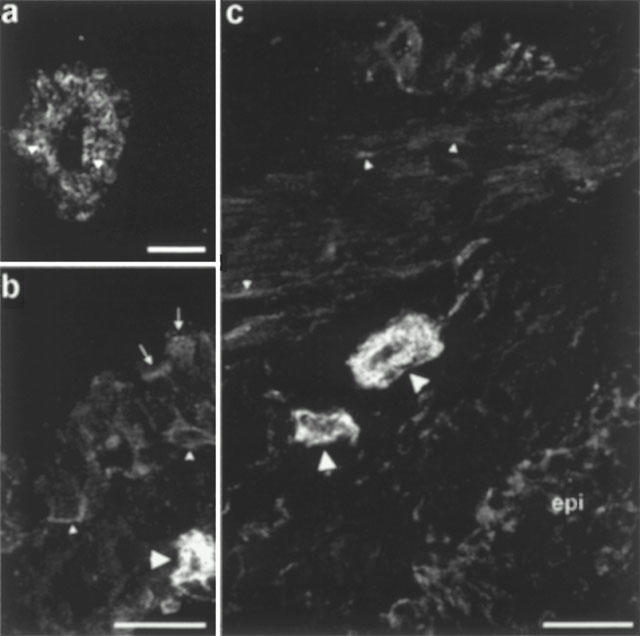
Figure 7.

Confocal microscopic images showing PAR1 immunofluorescence in rat bronchi, which is representative of the other two airway regions used in the functional studies. (a) A mast cell showing intense cytoplasmic immunofluorescence with distinct granules (arrowheads) showing no staining. (b) Faint staining of ciliated (arrows) and basal (small arrowheads) epithelial cells. A mast cell (large arrowhead) is shown to illustrate the low level of epithelial fluorescence. (c) Comparison of PAR-1 immunofluorescence on smooth muscle (small arrowheads), mast cells (large arrowheads) and the epithelium (epi). Only a few smooth muscle cells show patchy surface staining while most cells appear to show very weak cytoplasmic staining. The scale bar in (a) represents 10 μm, whilst those in (b) and (c) represent 25 μm.
