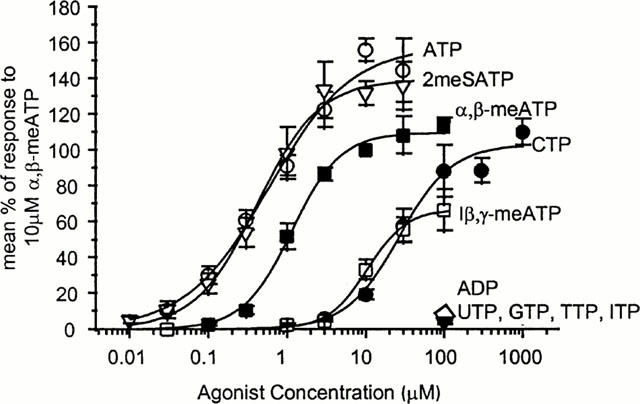
Figure 6.

Concentration response relationships for a range of nucleotides at rat mesenteric artery P2X receptors showing ATP, 2meSATP, α,β-meATP, l-β,γ-meATP, UTP, GTP, TTP, and ITP. All data are expressed as per cent of response to 10 μM α,β-meATP, n=4–11 for each point.
