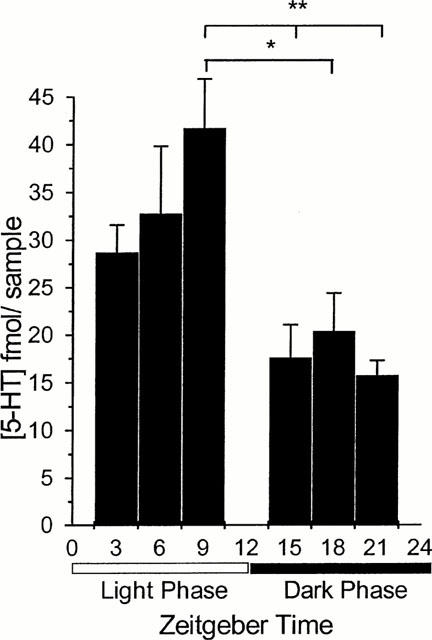
Figure 1.

Basal 5-HT concentration as measured in dialysate from the SCN region at six zeitgeber times across the 12 : 12 h light:dark cycle; lights off at ZT 12. Data are expressed as mean±s.e.mean (n=4–8). Basal 5-HT levels at ZT 15, 18 and 21 are significantly different from basal levels measured at ZT 9. *P<0.05; **P<0.01 (one way ANOVA with Tukey's post hoc test).
