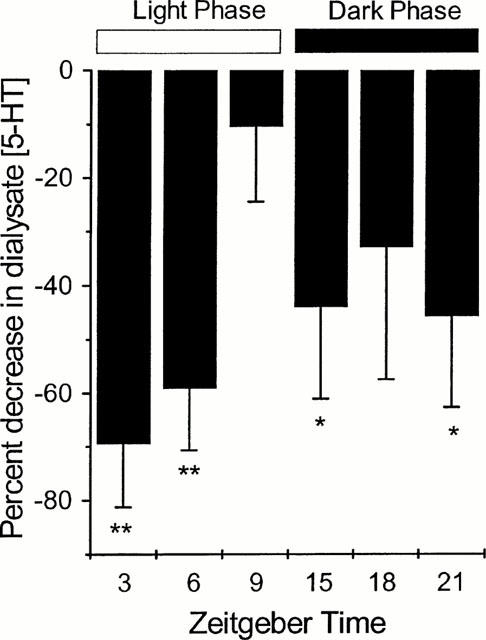
Figure 4.

Percentage maximal decrease in 5-HT overflow following infusion of RU24969 (1 μM; 15 min) at ZTs 3, 6, 9, 15, 18 and 21. *P<0.05; **P<0.01 (one way ANOVA with repeated measures with Student Newman Keuls post hoc test). Maximal decrease in dialysate 5-HT concentration post-RU24969 infusion is plotted versus the zeitgeber time and represented as a negative percentage.
