
Figure 2.
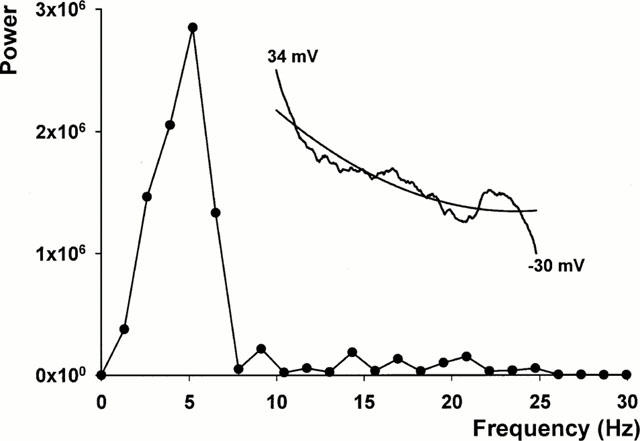
Fast Fourier transform analysis of the frequency power spectrum of an action potential plateau in an ATX II treated myocyte. The FFT shows a discrete power peak at about 5 Hz along with low amplitude signals at higher frequencies. The inset shows the original truncated action potential recording from its peak voltage of 34 to −30 mV and the nonlinear regression fit. The truncated action potential record contains irregular low amplitude membrane voltage oscillations and an EAD.