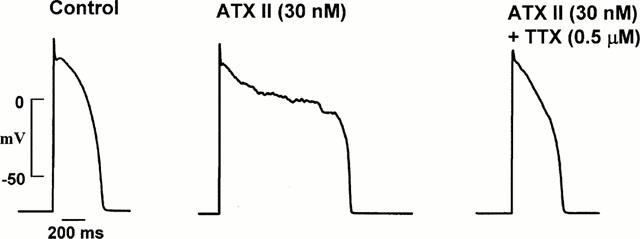
Figure 6.

Effect of TTX (0.5 μM) on the action potential. The left panel shows the control action potential. The middle panel shows ATX II-induced action potential prolongation accompanied by irregular low amplitude membrane voltage oscillations and an EAD. The addition of TTX shortened action potential duration and suppressed the irregular low amplitude membrane voltage oscillations as shown in the right panel. Data from the same cell.
