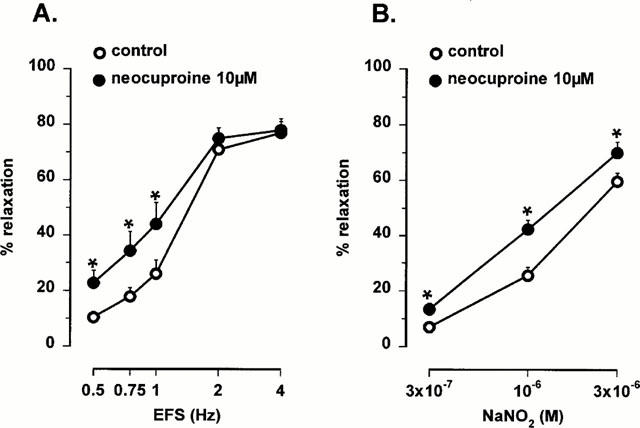
Figure 3.

Frequency-response curves to electrical field stimulation (EFS, 0.5 – 4 Hz) and concentration-response curves to NO (0.3 – 3 μM, added as acidified NaNO2) in the mouse gastric fundus in control conditions and in the presence of 10 μM neocuproine. Results are expressed as percentage decrease of the prostaglandin F2α-induced contraction and shown as mean±s.e.mean for n=5 – 7 experiments. *P<0.05 is considered as significantly different from control, Student's t-test for paired values.
