
Figure 4.
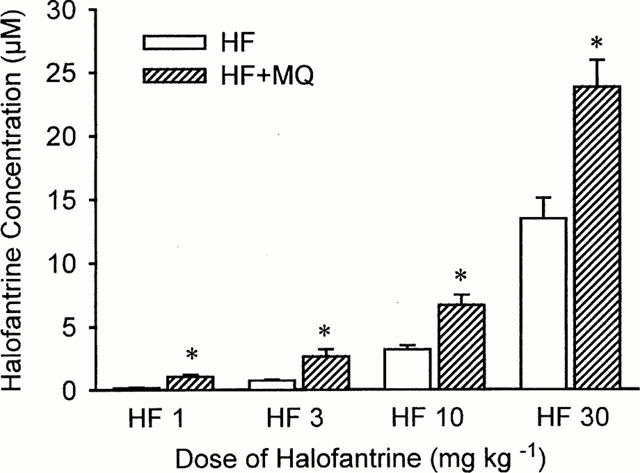
The concentrations of halofantrine measured by high performance liquid chromatography in blood samples taken 20 min after administration of each dose of halofantrine from animals receiving halofantrine alone (HF) or halofantrine after 3 mg kg−1 mefloquine (HF+MQ). Values are means with vertical bars indicating s.e.mean, n=6 per group. *P<0.05 compared halofantrine group, Kruskal – Wallis test.