
Figure 5.
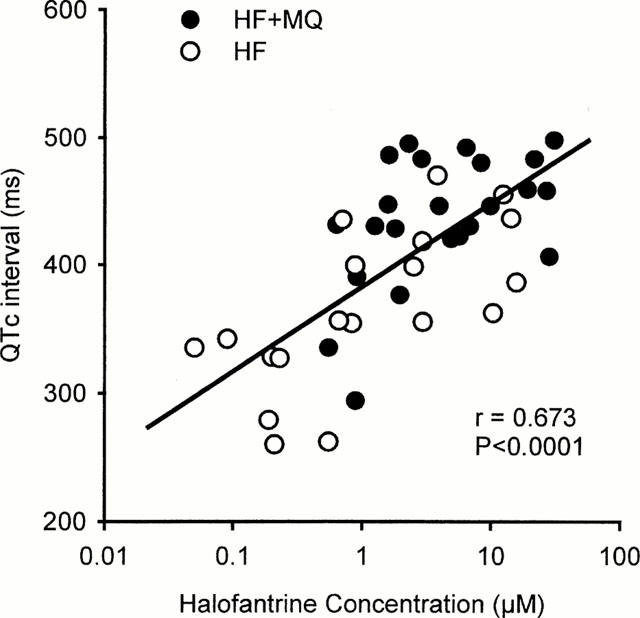
Correlation between the individual values for QTc intervals measured 20 min after administration of each dose of halofantrine and the blood concentrations of halofantrine in samples obtained at those time points from animals receiving halofantrine alone (HF) or halofantrine after 3 mg kg−1 mefloquine (HF+MQ).