
Figure 2.
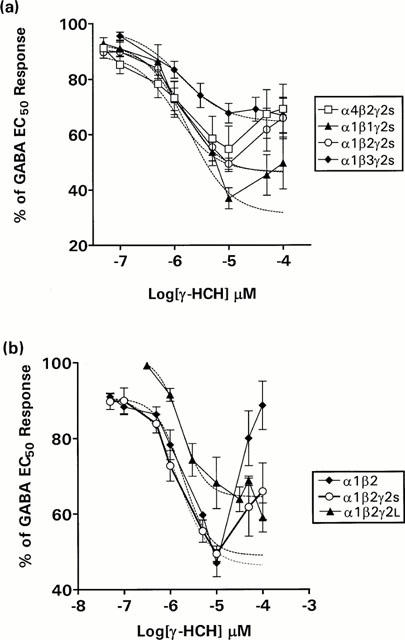
Concentration-response curve for the effects of γ-HCH on GABA EC50 responses on oocytes expressing α1β1γ2S, α1β2γ2S, α1β3γ2S and α4β2γ2S (a) and α1β2, α1β2γ2s, and α1β2γ2L GABAA receptors (b). Each data point represents the arithmetic mean±s.e.mean of 6 – 8 experiments. Data were calculated as a percentage of GABA EC50 responses. Data points showing reversal of inhibition (typically at concentrations of γ-HCH>10 μM) were omitted for the curve fitting procedure; however, the data points are shown in the plots (solid lines). Dashed lines show the fitted curve.