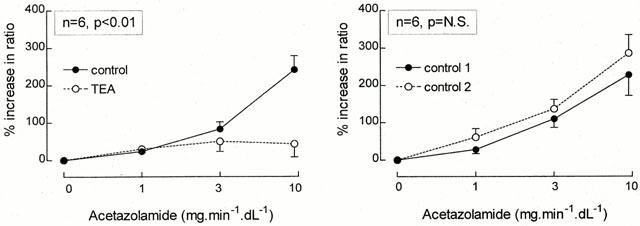
Figure 1.

Percentage increase in the ratio of the infused and non-infused arms during graded acetazolamide infusion, both in the absence (•/solid line) as well as during concomitant infusion (○/dashed line) of TEA (left panel) or placebo (right panel) is presented as mean±s.e.mean. The P-value refers to the statistical difference between conditions for these responses as analysed by repeated measures ANOVA.
