
Figure 5.
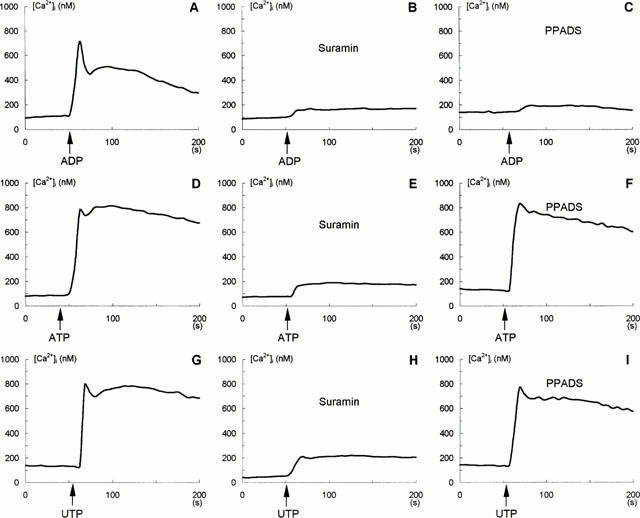
Effect of P2Y nucleotide receptor antagonists, suramin and PPADS, on ADP-, ATP- and UTP-induced changes in [Ca2+]i in glioma C6 cells. [Ca2+]i was measured as described under Methods and experiments were performed in the standard buffer containing 2 mM CaCl2. A,D,G: Control cells, (A) 10 μM ADP added, (D) 100 μM ATP added, (G) 100 μM UTP added. B,E,H: Cells were treated with 1 mM suramin for 10 min prior to addition of 10 μM ADP (B), 100 μM ATP (E) and 100 μM UTP (H). G,F,I: Cells were treated with 100 μM PPADS for 2 min prior to addition of 10 μM ADP (C), 100 μM (F) and 100 μM UTP (I). Additions of ADP, ATP and UTP are indicated by arrows. Each trace represents a mean value for 24 cells. Each experiment was conducted on three separate occasions.